Diversity, Equity & Inclusion
Diversity in the Shopfloor Manufacturing Workforce is Great for Business
6 min read

Research demonstrates* the business case for Diversity, Equity and Inclusion is clear, however, this tends to be centred around executive team composition or the office-based workforce. The manufacturing sector accounts for approximately 16% of world GDP^ and employs 14% of the total workforce, so defining a bespoke business case in the operations environment is key.
*Research sourced from Harvard Business Review, McKinsey & Company and Deloitte. ^GDP data sourced from report available here.
The main manufacturing KPIs of quality, safety and cost are all impacted by Diversity, Equity & Inclusion (DE&I). A psychologically safe workplace, where people can speak up without fear of retribution, is a safe workplace, reducing lost time injury frequency rate. Where there is employee diversity, these different knowledge, experience, perspective and skills lead to challenge and improved decision making, with positive impacts on production quality and cost.
The Client
A global client with 3,000+ employees based in six countries wanted to undertake a quantitative and qualitative analysis of DE&I in their organisation.
The Human Resources Director was keen to progress while the other members of the executive team were curious yet sceptical. They wanted to understand how a diverse workforce improved their manufacturing business performance to engage and empower their workforce to create a sense of urgency and catalyst for change.
Our Approach
We were provided with four months of factory operations data from one of their locations, detailing hours worked per employee (data on over 100 employees across 12 different teams), and the operational efficiency of their production line.
We used a diversity index which considered both demographic diversity (age, gender, nationality etc.) and workplace diversity (normal working hours and tenure) to give normalised scores (every score was converted to a range of 0-1 for direct comparison) for each dimension, giving an overall diversity score.
Teams were analysed for their operational and actual work efficiency each month alongside our diversity indices. The regression analysis was performed for both raw values and the normalised scores, comparing team diversity to operational and actual efficiency.
- Operational Labour Efficiency – Comparing the expected time taken for the process steps the department was involved with, against the actual time taken to complete those steps.
- Actual Labour Efficiency – Comparing the predicted operational hours against the real hours worked by the department’s employees.
From the regression analysis, we noticed multiple trends as detailed below.
Operational labour efficiency
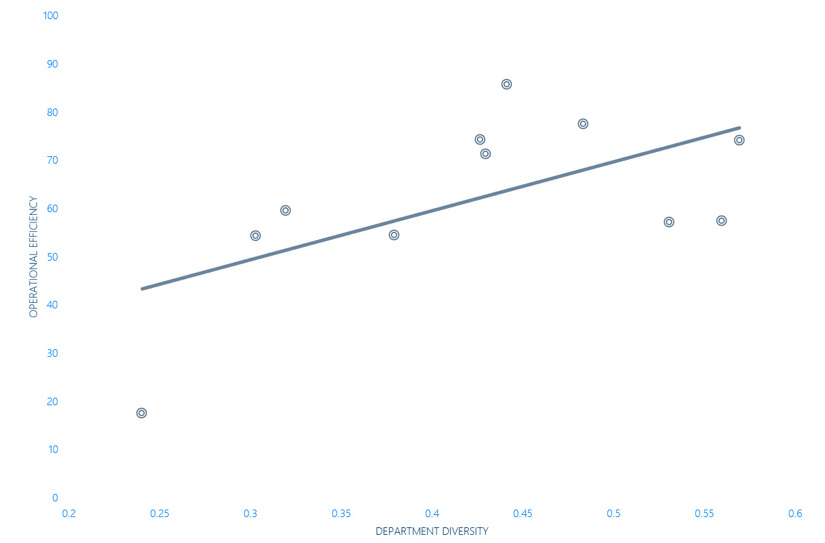
We found that when analysing data across all four months, increasing team diversity within a department led to a statistically significant increase in their operational effectiveness. Every 0.1 increase in team diversity leads to an 8.5% increase in efficiency. (Figure 1)
Interestingly, we found high tenure inequality, where there were teams with separate groups of very experienced employees and newer joiners. With every 0.1 increase in tenure disparity, operational efficiency decreased by 5.6%, highlighting the urgent need to focus on team cohesion and induction programmes.
Figure 1: Operational labour efficiency increasing with department diversity
Actual labour efficiency
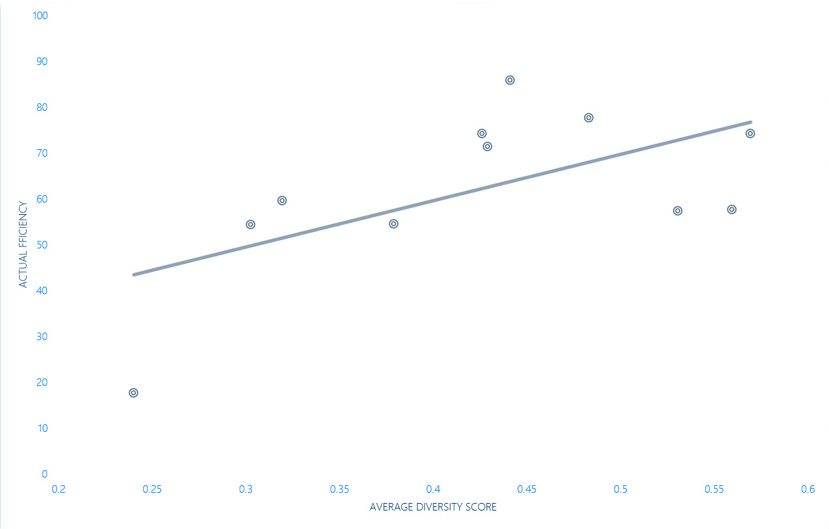
Departmental diversity was also likely to be an increase in the actual efficiency, as with every 0.1 increase in overall diversity score, the actual efficiency increased by 7%. (Figure 2).
Furthermore, a greater variety of ages and gender parity were also significantly associated with increased efficiency, with each increasing the efficiency by 2.4% and 2.9% for every 0.1 increase in their respective score. This suggests that age and gender diversity had a positive effect on the team’s performance.
Figure 2: Actual labour efficiency increasing with department diversity
From insight to action: ensure diversity in all teams
People of similar identities can naturally cluster together. Where this becomes the dominant culture, it then sets the “rules” for the non-dominant group and can create barriers to entry. For example, in the final inspection part of the production line, 90%+ of the employees were women, however, in seven out of the 11 processes leading to this, the workforce was all men, even though there were no physical constraints to women working there (e.g. lifting items over 20kg was not required).
Actions include:
- Bust the bias of which areas people can work in. Where feasible, reallocate existing team members across departments to create more diverse groups.
- With the UK manufacturing base reporting an average turnover of 17.6% in 2020, higher than the UK average of 15%, there is a clear opportunity to focus on diversity when recruiting new employees.
- When placing new recruits within teams, wherever possible ensure there are three of the same demographic to avoid “tokenism” and ensure everyone feels part of the team, they can directly relate to other team members and are valued.
Flexible working for all
With manufacturing roles, location flexibility is not an option, however, there are many options regarding timing. Consider offering some or all of the following, whilst ensuring the operations run as scheduled:
- Talk to your workforce. What flexibility would they like and what would that look like? How would information be communicated, decisions made, and transparency be assured for all?
- Where feasible, offer split shifts e.g. not everyone can work 12-hour shifts, and so offer two six-hour shifts.
- Consider staggered shift start and end times e.g. a cohort of early starters and late finishers.
- Consider offering part-time shift patterns e.g. rather than four days on, four days off, two-and-a-half or three days on.
The journey continues...
Following on from the DE&I assessment, the client has carried out a number of actions, including:
- The creation of a DE&I two-page policy, outlining to every employee why DE&I is good for business, and the expectations going forward of I, we, you, i.e. the executive team, whole organisation and every employee.
- The definition of a DE&I balanced scorecard, built bottom-up by country.
- The creation of an omnichannel communication plan to engage and empower all with progress, updates, country level action plans and upcoming training etc.
We continue to follow up with our clients to identify all DE&I outcomes.
Our vision of Diversity, Equity & Inclusion Consulting at Odgers Berndtson:
We make organisations demonstrably more inclusive through providing strategy, analytics and training.
How:
- Evidence based.
- Smart yet simple frameworks and methodologies.
- Conscious of your organisation's context.
- Delivered by DE&I practitioners.
If you would like to define the bespoke business case for diversity, equity and inclusion within your organisation, or how we can help you accelerate your DE&I journey, please contact us.
Never miss an issue
Subscribe to our global magazine to hear our latest insights, opinions and featured articles.
Follow us
Join us on our social media channels and see how we're addressing today's biggest issues.